
[FREE] How does Figma improve insight freshness by 10x?
Change data capture and more.

With only $7/month (billed annually), you can access all the materials you need to grow from junior → senior DE.
200+ deep-dive data engineering articles
practice-spark: 65 LeetCode-style problems to practice Spark SQL/DataFrame
learn-spark/dbt/airflow: CLI tools to master Spark/dbt/Airflow
If you’re a student with an education email, use this 50% ANNUAL DISCOUNT
If you’re a Vietnamese user, please DM me for an upgrade due to payment issues. As compensation for the inconvenience, you’ll get 50% OFF the annual plan.
Intro
It has been a long time since I analyzed data engineering use cases from big tech companies.
Last week, I came across an article from Figma about how they updated their data pipeline to improve data freshness. The blog includes many interesting technical details we can learn from.
So, here we are. In the rest of the article, you will read my notes and observations after reading Figma's blog post, "From multi-day latency to near real-time insights: Figma’s data pipeline upgrade."
Disclaimer, all the technical details are come from this blog post; I only deliver my understand as well as the analyzes and the observations.
About Figma
Figma is a design and collaboration platform primarily used for creating websites, mobile apps, and user interfaces.
In short, when you need to design a front-end UI, Figma is always a top choice; millions of users have trusted the platform.
And you know what? Large user bases usually come with massive amounts of data and a high demand for using that data to better serve users.
Problem
To perform analytical workloads and extract insights, Figma must find a way to sync data from OLTP databases to OLAP databases.
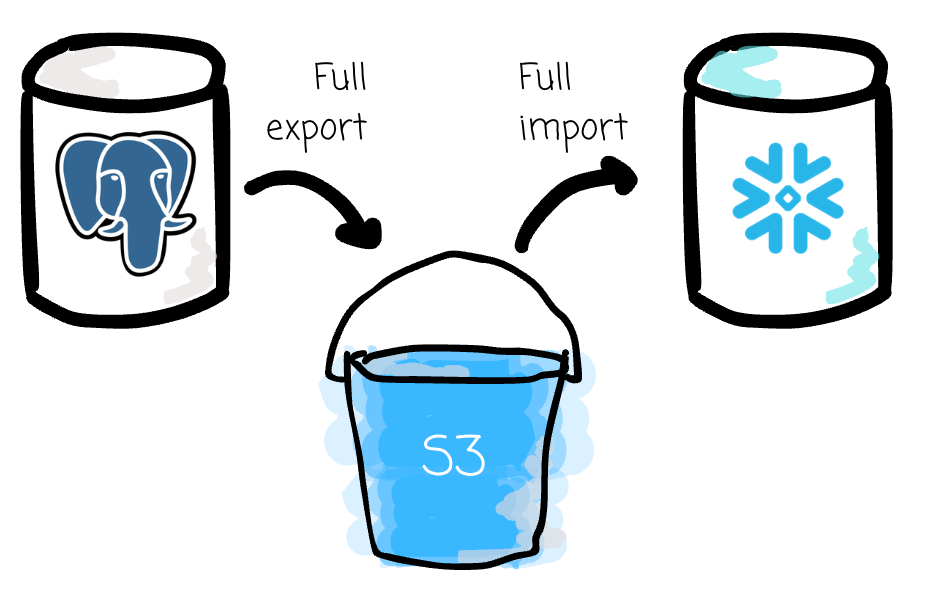
Their legacy synchronization process, built in 2020, simply exports data from the OLTP databases (RDS PostgreSQL) via a cron job to S3; the data is then imported into Snowflake.
However, this approach has a downside; the higher the data volume, the longer the process. Exporting with SELECT * will be slower as the table grows.
By 2023, the synchronization process took Figma roughly 6 hours to complete. The delay in synchronization means the delay in business insight delivery.
Incremental synchronization
Fully exporting the table is not a sustainable way.
Incremental synchronization is. And you might have your guess now.
It’s Change Data Capture (CDC).
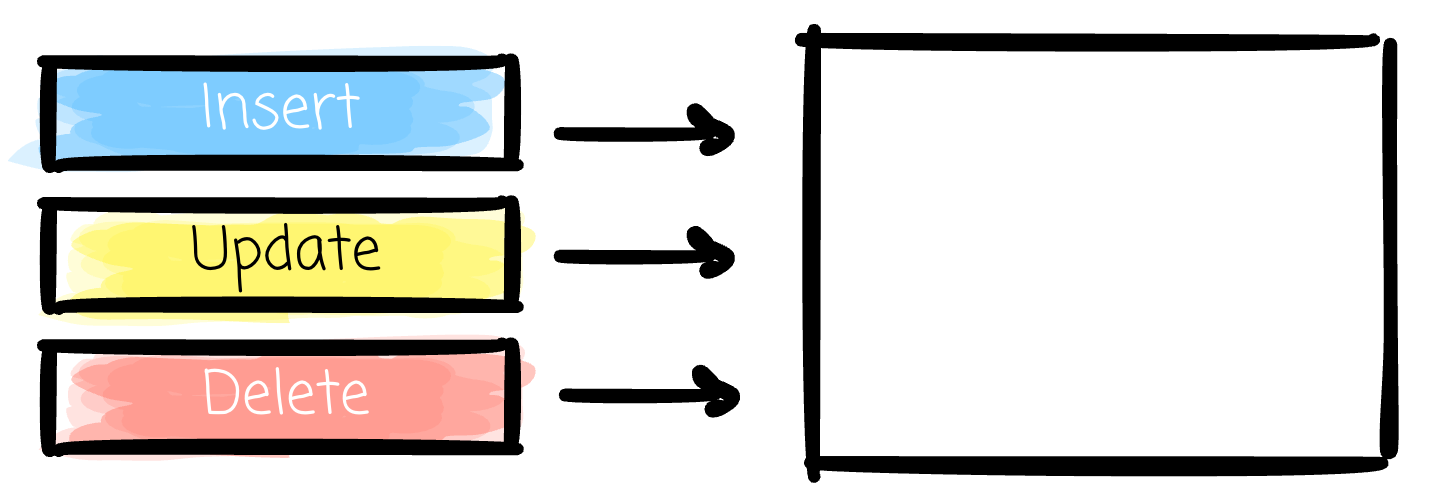
When mentioning CDC, the most common and efficient approach is log-based CDC.
The method operates by reading changes directly from the database’s transaction “log”. It is implemented differently depending on the DBMS. However, the high-level idea is quite the same.
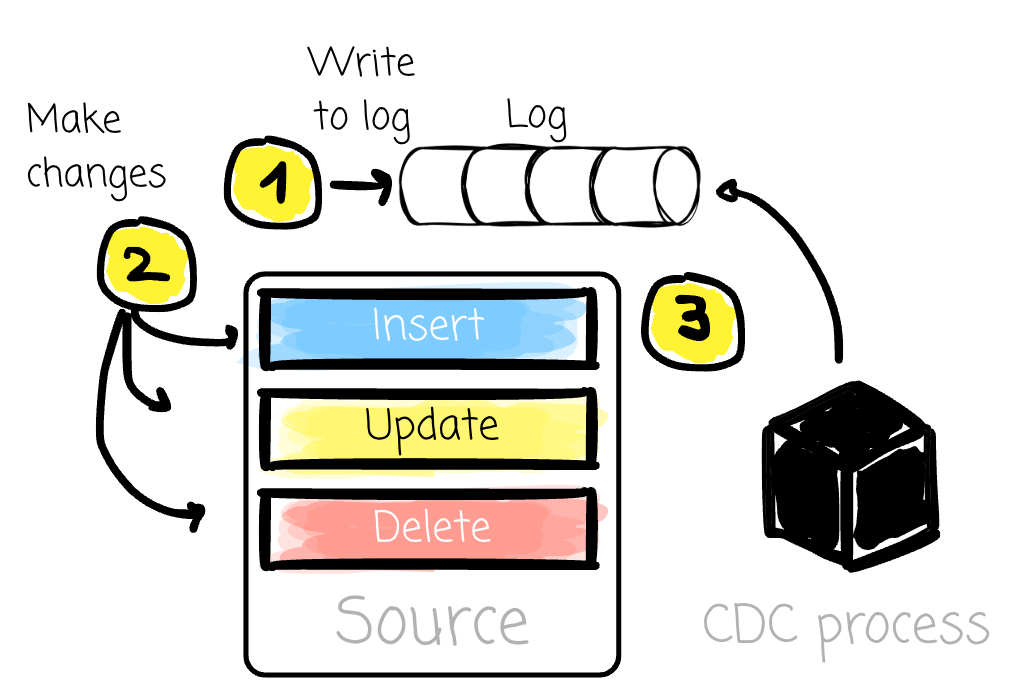
The “log“ serves as an ordered, durable, and complete record of every committed transaction. A CDC tool with a log-based reader taps into this stream of log records, parses them, and propagates them to downstream systems.
The log-based approach provides many advantages:
Minimal Performance Impact: Because the process reads from log files rather than executing queries against tables, log-based CDC enables continuous change capture with minimal performance overhead.
Completeness: The “log” is the ultimate source of truth for all data modifications. Log-based CDC can therefore capture all types of changes.
Low Latency: By reading changes as they are committed to the log, this method provides near-real-time updates to consuming systems.
The most obvious downside of this method is the complexity; a lot of components to manage: the message system, the message consumer, and the data merger. The more tables that need CDC, the more management overhead there is.
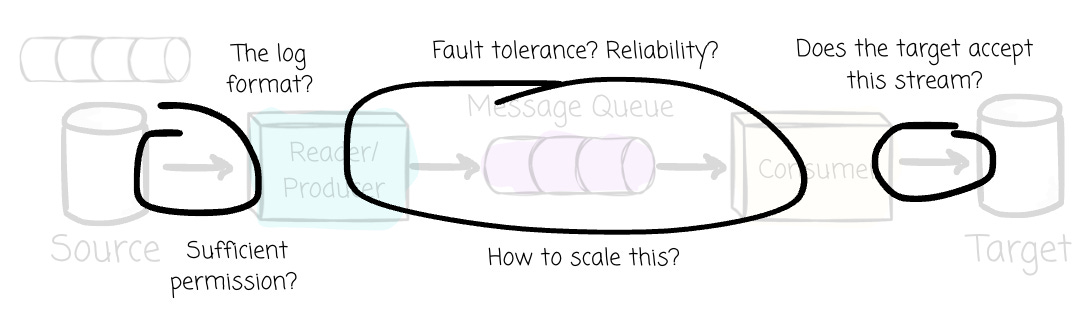
In addition, it often requires specific database configurations, such as enabling logical replication in PostgreSQL. It may also require elevated system permissions to grant the CDC process access to the transaction log files, which can be a challenge in strictly controlled environments.
Back to the Figma case, they decided to go with the CDC approach, but to handle the company's data scale, they chose to build the whole solution themselves rather than buy from a vendor to achieve flexibility and scalability while saving costs.
With only $7/month (billed annually), you can access all the materials you need to grow from junior → senior DE.
200+ deep-dive data engineering articles
practice-spark: 65 LeetCode-style problems to practice Spark SQL/DataFrame
learn-spark/dbt/airflow: CLI tools to master Spark/dbt/Airflow
If you’re a student with an education email, use this 50% ANNUAL DISCOUNT
If you’re a Vietnamese user, please DM me for an upgrade due to payment issues. As compensation for the inconvenience, you’ll get 50% OFF the annual plan.
The new pipeline
One thing to note is that, to enable CDC, you must first have the current state of the table, the snapshot; from there, changes come as the log message will be merged with the initial snapshot to capture the change from the source table.
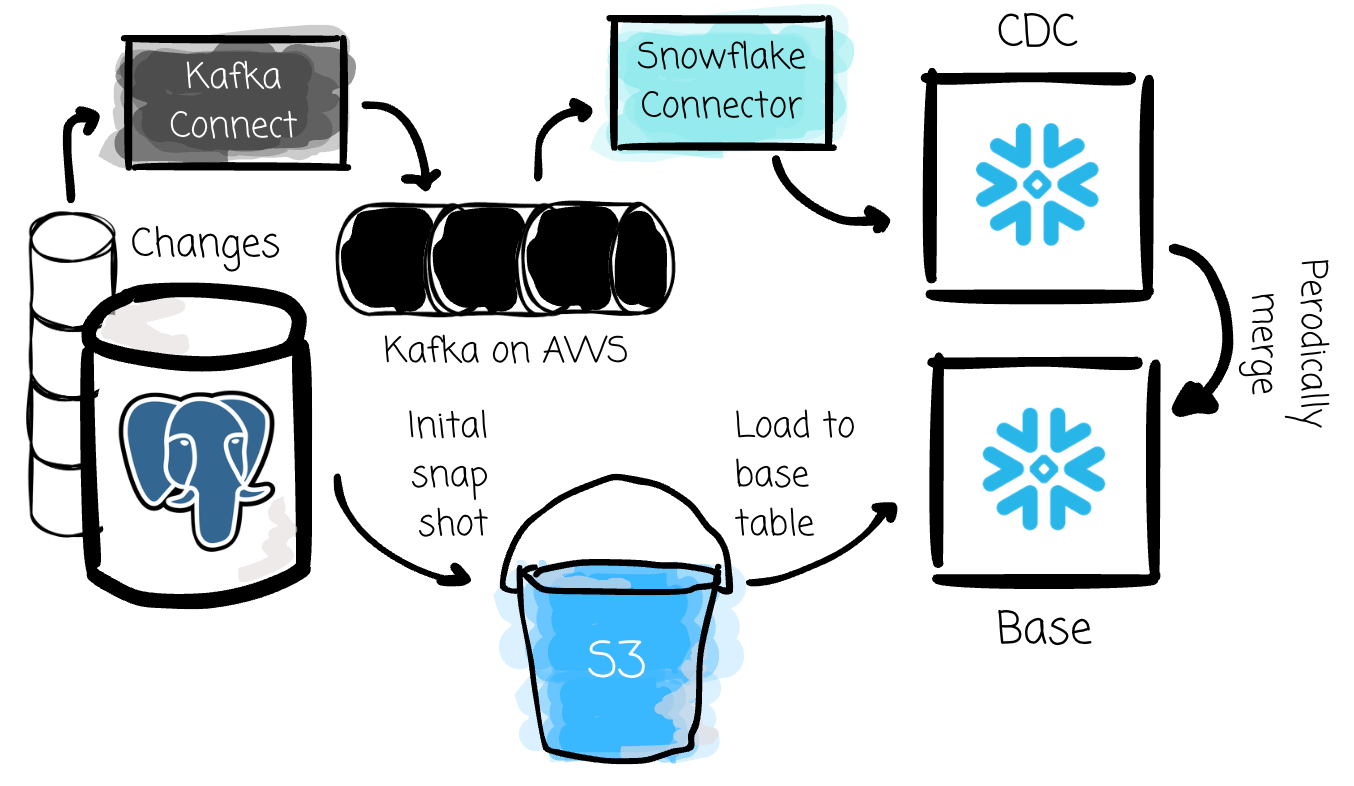
For the initial snapshot, Figma simply leverages RDS to export to S3.
For the CDC setup, they leverage Kafka Connect, Snowflake Connector, and Amazon Managed Streaming for Apache Kafka (MSK).
To merge delta changes, Figma built custom Snowflake stored procedures.
For any new table that requires synchronization, the following things happen:
A new table in Postgres is automatically captured by the Figma CDC automated service; the change stream is then published to Kafka’s per-table topics.
The table’s latest snapshot will be exported to S3.
Then they import the data to a Snowflake table.
Snowflake Sink Connector will consume data from the associated Kafka topic and write it to a CDC table.
Periodically, the merge store procedure runs to merge data from the base table and the CDC table.
And that’s not all; to ensure robustness, Figma must validate the data.
For each onboarding CDC table, Figma will clone its source table and compare it against the source table. The goal is to ensure they have the exact data. The compared output is then integrated into Figma’s monitoring and alert system.
Besides scalability, data integrity is definitely Figma’s ultimate goal.
Automation
To scale, the onboarding and validation process must be automated.
For this purpose, Figma uses AWS Step Functions.
In Step Functions, there is a concept called workflows, which facilitate automated processes or orchestrate microservices.
To automate CDC processes, Figma develops two levels of automation, each with an associated set of workflows:
First-level: this includes workflows they can trigger manually. Those workflows execute bootstrap or validation processes by providing only the table name. No manual intervention except when there are alerts: a software bug or the validation fails.
Second-level: this includes workflows designed to trigger first-level automations based on specific conditions and schedules. After the first level is complete, the second level checks the current states to determine whether it needs to trigger another first-level automation. For example, a workflow that periodically checks for new tables to perform onboarding.
To test these automations, Figma re-onboards all tables in the staging environment every week for simulation and to detect any issues. They actually identified an issue that could cause 20 minutes of downtime if it reaches production.
With only $7/month (billed annually), you can access all the materials you need to grow from junior → senior DE.
200+ deep-dive data engineering articles
practice-spark: 65 LeetCode-style problems to practice Spark SQL/DataFrame
learn-spark/dbt/airflow: CLI tools to master Spark/dbt/Airflow
If you’re a student with an education email, use this 50% ANNUAL DISCOUNT
If you’re a Vietnamese user, please DM me for an upgrade due to payment issues. As compensation for the inconvenience, you’ll get 50% OFF the annual plan.
Result
By moving to incremental synchronization, Figma sees a lot of improvements:
Data freshness: data used to be 30 hours old or more; now it is reduced to 3 hours or could be lower based on user freshness configuration.
You might wonder; because change stream arrive near real-time, why it take 3 hours, the answer lie in the merge process. Figma set the default default merge frequency to every three hours. User can override the frequency, the more frequent the merge process, the more compute cost.
Scalability: no more periodic full exports, which means Figma can comfortably handle large tables, even if some are ten times larger than those used in the legacy synchronization process.
Productivity: insights can now be extracted sooner; CDC processes are now automated and abstracted by the CDC team.
Outro
In this article, we see how Figma improves data freshness by implementing an incremental approach using CDC to sync data, rather than the full-table export used in the past.
The lesson here is that, at a small scale, full exporting works well, even the ideal choice given its simplicity. However, when the data grows, full exports are painful.
Incremental synchronization is inevitable. It surely helps with the data scale and freshness. However, it comes with complexity.
As you can see, Figma invested heavily in onboarding and validation processes and in abstracting and automating them via AWS Step Functions.
At the end of the day, any technical decision has its trade-offs.
Thank you for reading this far. See you in my next article.
Reference
[1] Yichao Zhao, From multi-day latency to near real-time insights: Figma’s data pipeline upgrade (2025)