

To celebrate Lunar New Year (the true New Year holiday in Vietnam), I’m offering 50% off the annual subscription. The offer ends soon; grab it now to get full access to nearly 200 high-quality data engineering articles.
Intro
I started my data engineering in 2019.
Spark was released 5 years earlier.
Vendors released BigQuery and Snowflake 10 years earlier.
Hadoop was released 13 years earlier.
I was lucky enough to live in an era when there were a lot of technologies and tools to help data engineers streamline the “big data” storage and processing.
I was lucky enough to live in an era where what sits between a company and a robust data system is just a few clicks on cloud consoles instead of month after month of planning and setting up local servers.
But everything has a price.
Hardware in the past was expensive, software licenses and servers required spending upfront, and a robust data infrastructure needs time to plan and implement. They must ensure that data is organized and managed in a way that can support the business efficiently. They can’t throw data into the system and hope for the best. They carefully do the data modeling.
I live in an era where people belittle data modeling because they need to move fast and because “putting more resources” will somehow solve the slow and messy query.
I only realized the importance of data modeling a year ago, and since then, I’ve tried to learn this fundamental skill. Like most advice you’ve seen online, I started with the Data Warehouse Toolkit: The Definitive Guide to Dimensional Modeling.
This article notes what I learned from the book's first two chapters.
Data Warehousing
Since Bill Inmon laid the foundation of data warehousing in the late 1980s, separating the systems that produce data and the system that offers analytic capabilities has become the norm.
The “left” side records sign-up information, web tracking events, or orders worldwide. On this side, companies use systems optimized for transactional point queries with very high concurrency (OLTP).
The “right“ side gathers and organizes information from the systems on the “left“ side; it helps users answer questions like “How many users visited our website last week?“ or “How many orders came from Vietnam in the previous 3 months.“ On this side, companies use systems optimized for high-performance queries over vast amounts of historical data but might not need so much concurrency. (OLAP)
The two sides serve different needs. This article focuses on the “right“ side - the data warehousing:
The system should be intuitive for business users, not just developers.
Data from various sources must be presented with consistent labels and definitions.
The system should adapt to needs and changes.
It must safeguard sensitive information.
The data warehouse team and business users should agree on delivery timelines, mainly when time limits restrict data cleaning or validation.
It must have the right data to support decision-making.
The business users must accept the DW/BI system; you thought you built an excellent data warehousing system, but nobody used it; your solutions were not that great.
Kimball believes that dimensional modeling can help us build a data warehousing solution that meets all the above criteria.
Dimensional Modeling
Overview
Dimensional modeling first appeared in Ralph Kimball's 1996 book, The Data Warehouse Toolkit (1st edition). Organizations have widely adopted it to present analytic data. The approach aims for simplicity, which aligns with how most business users intuitively think.
They naturally think about their operations in terms of measurable metrics and the contexts in which those metrics are observed. For example, a retail manager might want to analyze sales performance by product categories, across different regions, and over time. This way of thinking is inherently dimensional: products, regions, and time are all distinct perspectives or dimensions through which performance can be evaluated.
Kimball’s approach promises to align with business users' thoughts. This alignment gives the user a tangible way to think of the data. Clear thinking leads to simple data modeling.
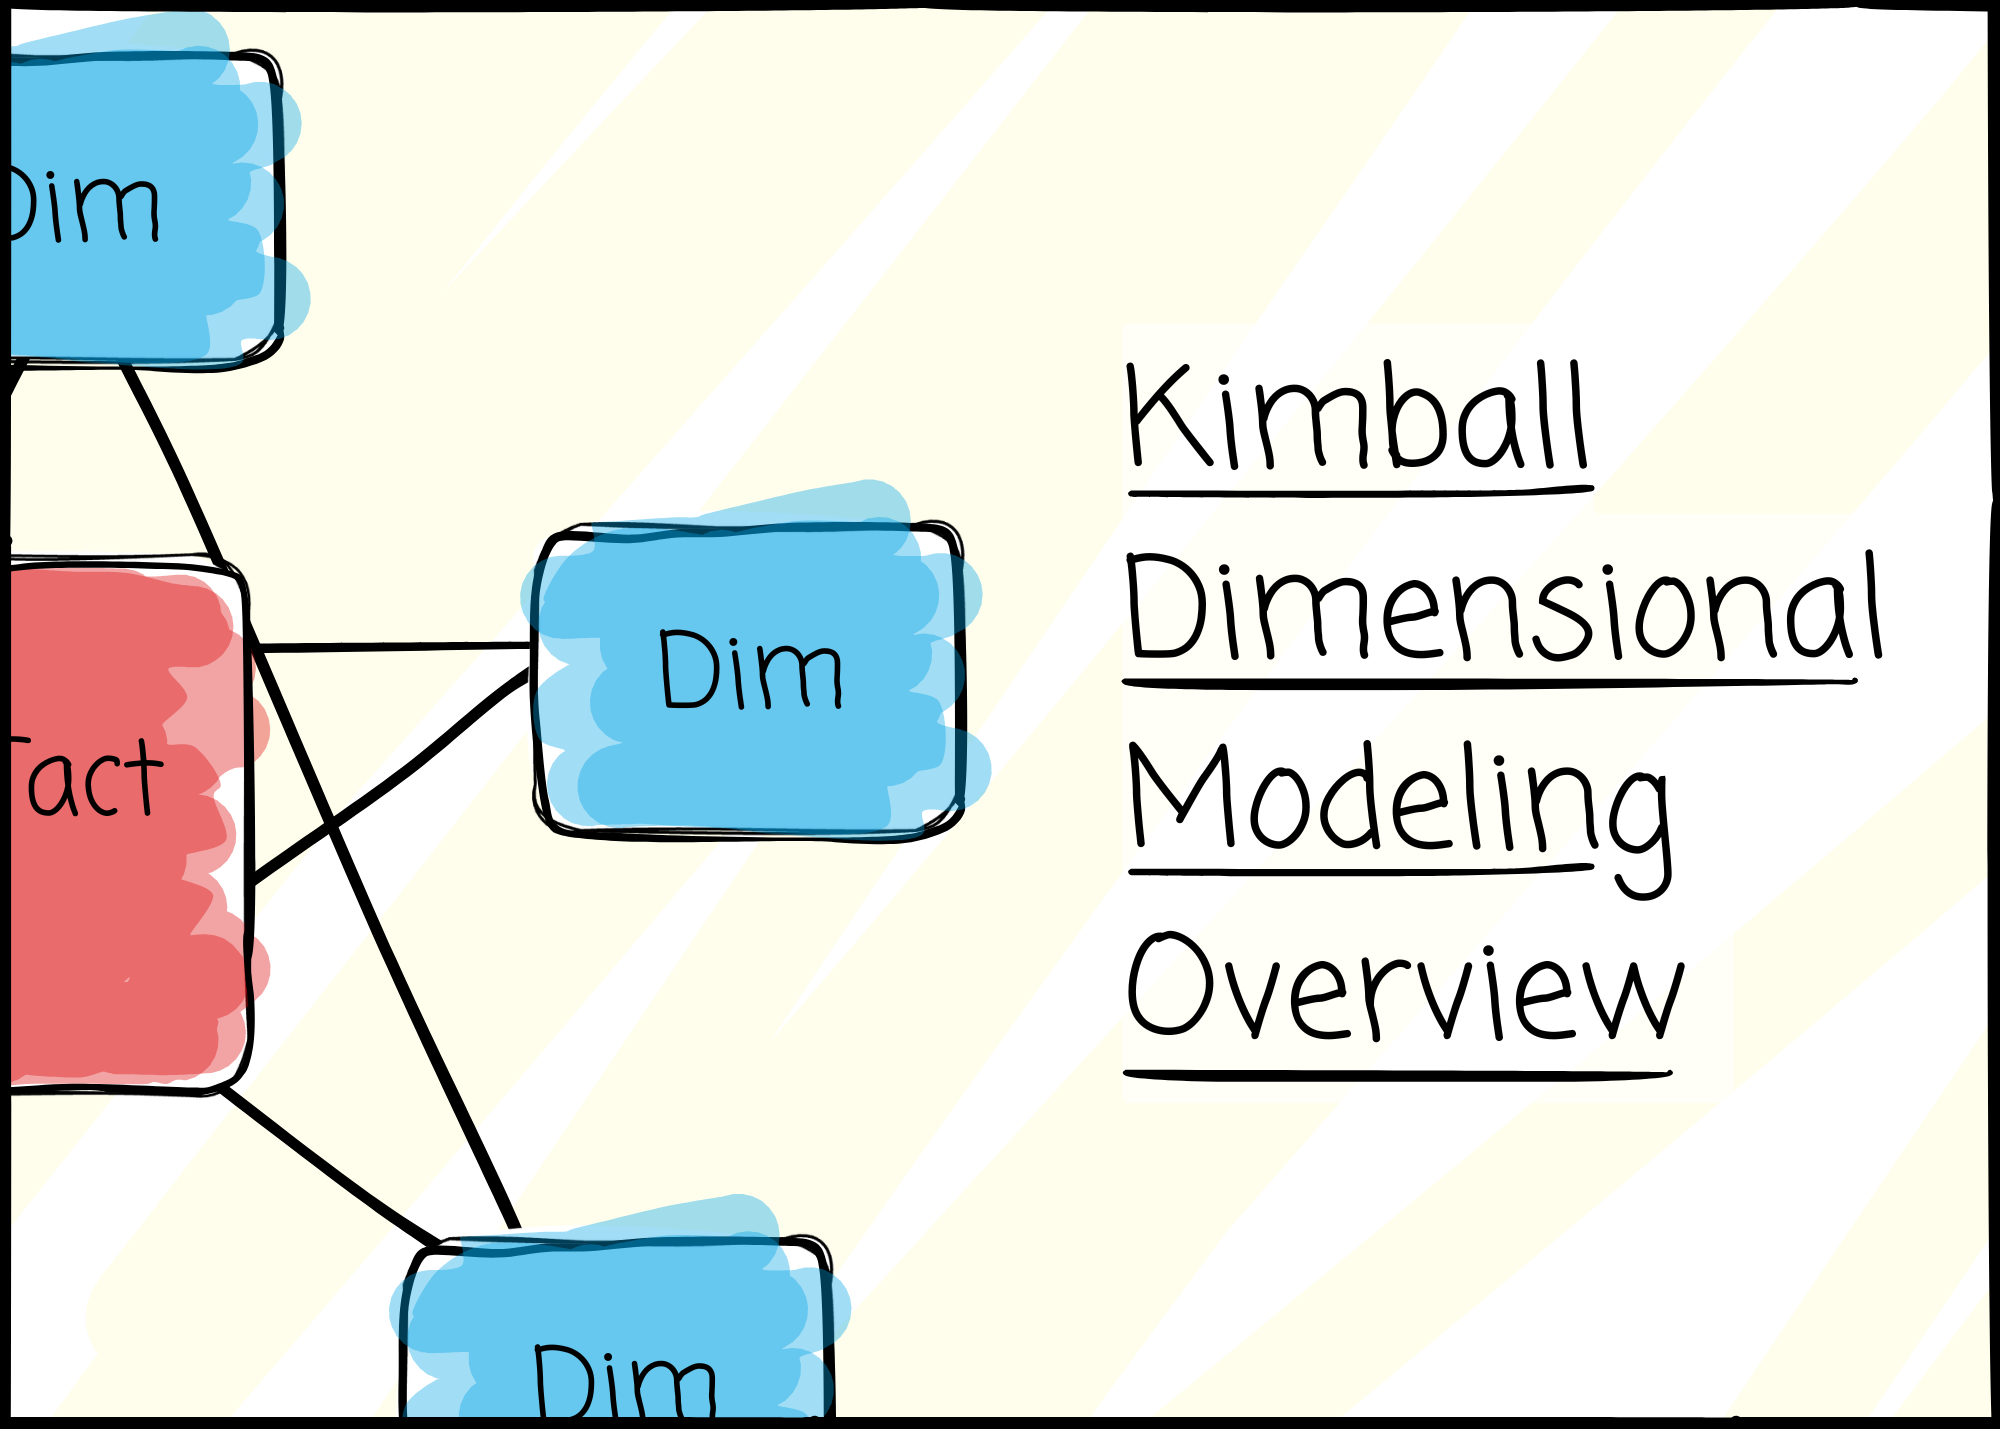
Star Schema
Dimensional modeling differs from the third standard form (3NF) models. Normalization’s ultimate goal is to ensure data integrity by removing redundancies. The normalized 3NF structures divide data into many entities, each a relational table. We store users’ information separately from the product’s information. This approach is helpful in operational processing, where data integrity is the priority.
However, it is too complicated for data warehousing. Figuring out how to calculate the January revenue of users from India can be overwhelming when they look at entity-relationship diagrams (ERDs) with hundreds of entities.
People implement dimensional models by organizing data in star schemas. Named for resembling a star, the schema consists of a central fact table surrounded by multiple-dimension tables.
To celebrate Lunar New Year (the true New Year holiday in Vietnam), I’m offering 50% off the annual subscription. The offer ends soon; grab it now to get full access to nearly 200 high-quality data engineering articles.
Fact
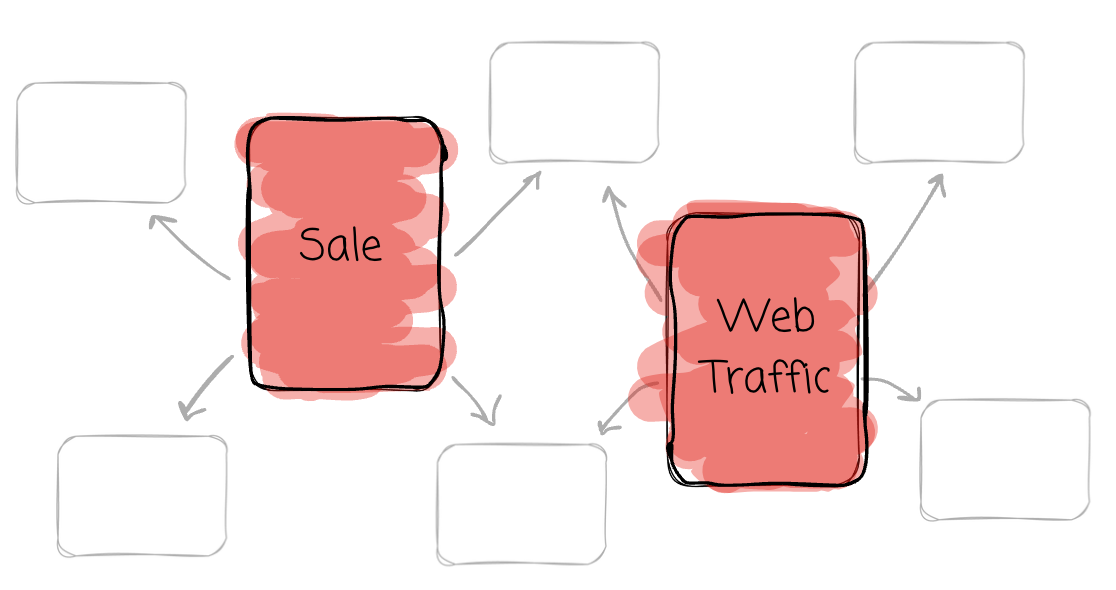
The fact table is the central table in the star schema. It stores the performance measurements resulting from an organization’s business process events. Kimball encourages us to store the low-level measurements to achieve more flexibility.
Each row in a fact table corresponds to a measurement event. The data on each row is at a specific level of detail, referred to as the grain; all rows in a fact table must be in the same grain. For example, each row in the event-tracking fact table corresponds to a user’s event, such as clicking a button or purchasing an item.
A fact’s row contains:
Foreign Keys: Links to the related dimension tables.
Measures: Numerical values, such as revenue, quantity sold, or profit.
When all the keys in the fact table correctly match their respective primary keys in the corresponding dimension tables, the tables satisfy referential integrity. Users can find insight by joining fact and dim using the foreign key from fact and the primary key from dim.
For example, a user’s revenue in Europe can be calculated by joining the revenue fact table (user grain) with the country dim table using the fact’s foreign key country code and the primary ID from the country dimension table, which records the country’s associated continent.
Dimension
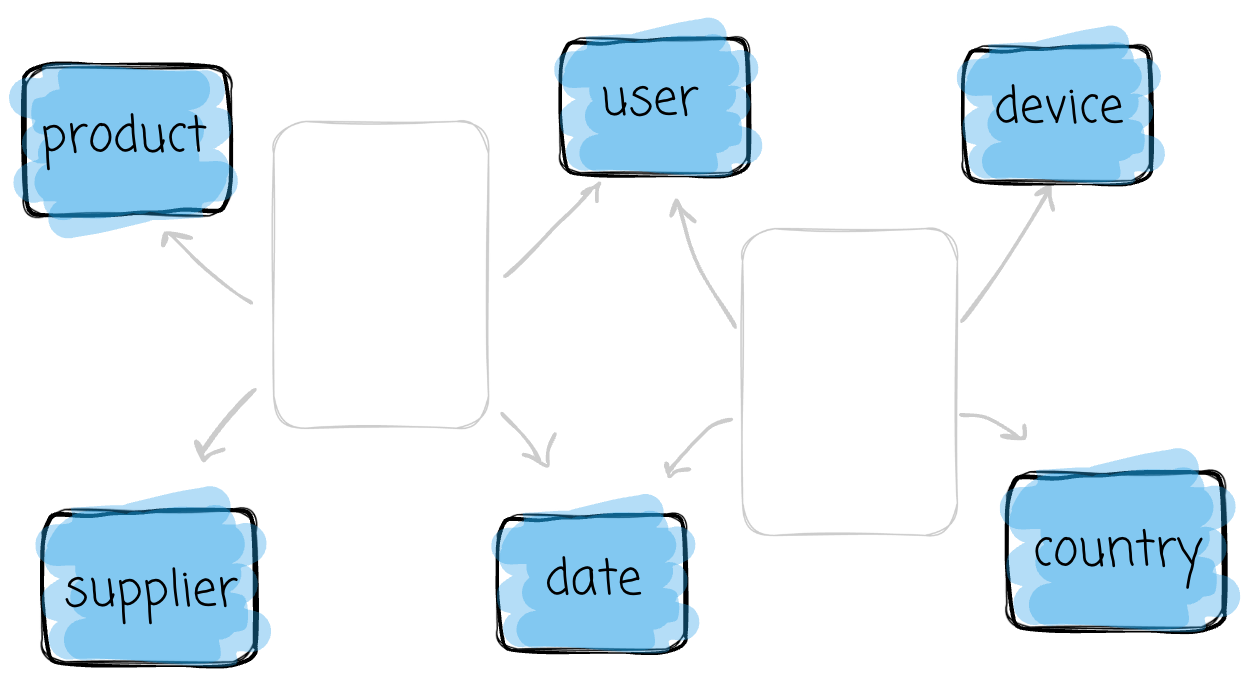
Dimension tables provide descriptive context for the facts. They describe the “who, what, where, when, how, and why.” Each table focuses on a business dimension, such as product, country, or date.
Dimension tables play a crucial role in the data warehousing system because they provide a context for measurements. A skyrocketing revenue number alone does not give insight into the business.
Kimball suggests that the data warehouse is only as good as the dimensions. We must model the dimensions’ attributes (columns) to ensure they are as close to the business terminology as possible.
Robust dimension attributes deliver robust analytic slicing-and-dicing capabilities.
The process
There are four steps in the dimensional design process:
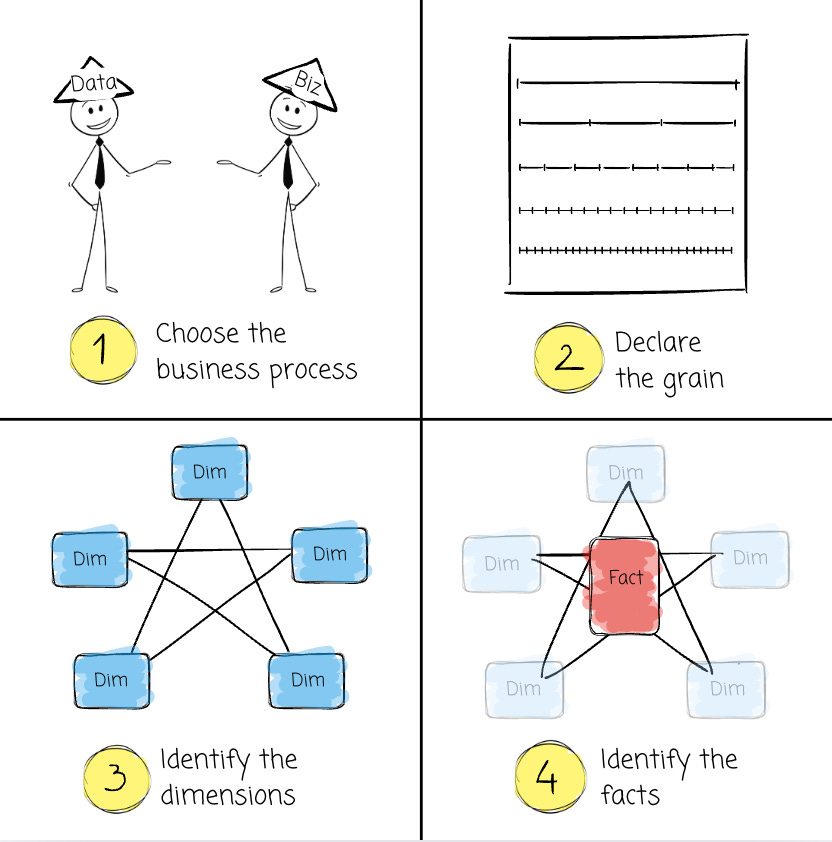
The process begins with selecting the business process, a step in which you identify the key activity or operation to analyze, such as sales, inventory management, or customer interactions.
Next comes declaring the grain, which defines the level of detail for your analysis; “are you tracking sales by individual transactions, daily summaries, or monthly aggregates?” This clarity is foundational to ensure consistency and scalability.
Once we define the grain, we identify dimensions that capture the process's descriptive attributes, such as product details, time, or customer demographics.
Finally, we focus on identifying facts and the quantitative metrics or measures tied to the process, such as sales revenue, quantity sold, or discount amounts.
Each step builds on the last, ensuring the design supports the bottom-up business's analytical needs while remaining easy to query and understand.
My thoughts
Although I don’t have much experience with dimensional data modeling, my neurons still form some thoughts about this topic after living in my last companies, where data modeling was the most luxurious thing. I will write down my thoughts (not only about dimensional modeling) here, hoping to learn from experts in this field.
The Kimball dimensional modeling approach is well-suited to how people observe their business: a measurement of a business process (fact) with contexts (dimension)
It might take less time to deliver the process compared to other approaches. If you are a newly hired data engineer on a team lacking time and resources, Kimball dimensional modeling seems a good choice.
Because the modeling is designed for specific analytical requirements, there is a chance that the Kimball dimensional modeling can’t adapt to a new requirement, and the modeler needs to model new facts and dims.
Adopting a proven modeling approach like the dimensional one is far better than dumping all your data into a cloud data warehouse. These established modeling frameworks are designed and tested to ensure data understandability and effective management. If you encounter challenges in managing your data, leveraging a widely used approach allows you to tap into a wealth of community knowledge and solutions. In contrast, choosing a strategy that only you or your team understands makes troubleshooting and scaling much harder.
Despite the wide adoption of dimensional modeling, companies also use other approaches, such as Inmon or Data Vault, to organize their analytics data. You must decide how to model your data based on the organization and its business; you can’t select Kimball when building a data warehouse from scratch just because you already read The Data Warehouse Toolkit 3 times.
My experience with One Big Table (OBT) is that it will prove its value only when we have a careful data modeling layer beneath it. Putting all the data in one table in the first place will make you trade data understandability for query performance, which is terrible.
Cloud data warehouses like BigQuery encourage users to denormalize using Nested or Array fields to improve performance by avoiding joins. This indirectly causes people to think that joins are bad; data modeling requires organizing information where it belongs, so it requires joins at the end; consequently, people also think data modeling is not good for query performance. I have been observing that BigQuery, Snowflake, or Databricks introduced the notions of Primary Key and Foreign Key in the last few years, plus some techniques to optimize the performance of joining using PK and FK; they encourage us to set these constraints on our table, they encourage us to organize data decently.
I’d love to hear from you if this has sparked ideas or questions.
Outro
In this article, I summarized the key insights I gained from reading the first two chapters of The Data Warehouse Toolkit. We explore the purpose of data warehousing systems, the approach and process of dimensional modeling, an introduction to facts and dimensions, and, finally, I share some of my thoughts on this topic.
Thank you for reading this far.
See you in my next piece!
Reference
[1] Ralph Kimball, Margy Ross, The Data Warehouse Toolkit: The Definitive Guide to Dimensional Modeling (3rd Edition)
Such a good consolidation of knowledge!
Every time I read about the Star Schema I struggle with one thing: How is the process to take the data from OLTP and put it into the OLAP system? I'm not talking about the DMS like a Data Factory, but how to store the data
Now that I'm writing this, another question comes: In a lakehouse (I use Databricks + azure DL), we can just extract everything from the OLTP, put it into a staging or raw layer and then, in the bronze layer, we model our facts and dimensions?
I'd appreciate if you can clarify those questions for me!
I think most schema become a bit less needed after the introduction of SSD and Python in data analysis.
Still need it in situations but with the cloud computing and the cost/speed of computing is quite cheap the schema only relevant in big team, corporation where you need good data governance, audit, permission control, history tracking ... While for purely data analysis star schema may not really as useful.