
Learn the Kimball dimensional modeling with a dbt project
From fundamental knowledge to actual handling of SCD 2 and building facts. Available codes so you can run along.

This is your last chance to grab the 50% discount on the yearly package; the offer will end today.
I will publish a paid article every Tuesday. I wrote these with one goal in mind: to offer my readers, whether they are feeling overwhelmed when beginning the journey or seeking a deeper understanding of the field, 15 minutes of practical lessons and insights on nearly everything related to data engineering.
Intro
In this article, I will attempt to stimulate a (real-life) data modeling project using dbt to manage SQL transformations. We revisit the Kimball data modeling techniques and what dbt is. Then, we start building the fact and dim tables. Especially, we will spend a lot of time dealing with SCD 2, from the hard way (using the dbt’s merge strategy) to using dbt snapshot.
Note 1: I used BigQuery (with 300$ free credit) as the warehouse system for this project. Feel free to connect your own data warehouse by adjusting the `profile.yml`.
Note 2: I assumed you have some basic understanding of how to set up a dbt project, so that I won’t dive too much into it.
Note 3: You can follow along by cloning this repo. Make sure you enter the cloned repo folder so that you can run the commands below. Make sure you set up your preferred data warehouse in the profiles.yml
The dimensional modeling
Dimensional modeling was first introduced in Ralph Kimball's 1996 book, The Data Warehouse Toolkit (1st edition). Since then, companies have been widely adopting it to organize analytic data. The approach is popular because it aligns with how business users think.
They naturally think about their operations in terms of measurable metrics and the contexts in which those metrics are observed. For example, a user might want to analyze sales performance by product category, across different regions, over the last 4 weeks. This way of thinking is inherently dimensional: products, regions, and time are all distinct perspectives or dimensions through which performance can be evaluated.
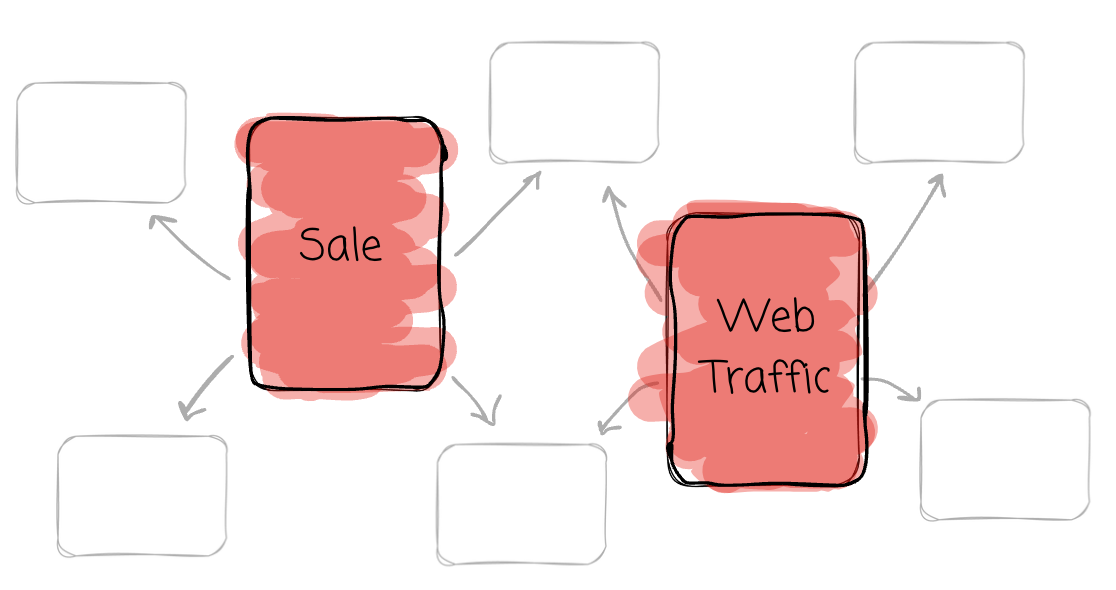
The dimensional modeling data in star schemas. Named for its resemblance to a star, the schema consists of a central fact table surrounded by multiple-dimensional tables.
Fact
The fact table is the central table in the star schema. It stores the performance measurements resulting from an organization’s business process events. Kimball encourages us to store the low-level measurements to achieve more flexibility.
Each row in a fact table corresponds to a real-life measurement event and contains:
Foreign Keys: Links to the related dimension tables.
Measures: Numerical values, such as revenue, quantity sold, or profit.
The data on each row is at a specific level of detail, referred to as the grain; all rows must be at the same grain level.
Dimension
Dimension tables provide context for the facts. They describe the “who, what, where, when, how, and why.” Each table focuses on a business dimension, such as product, country, or date.
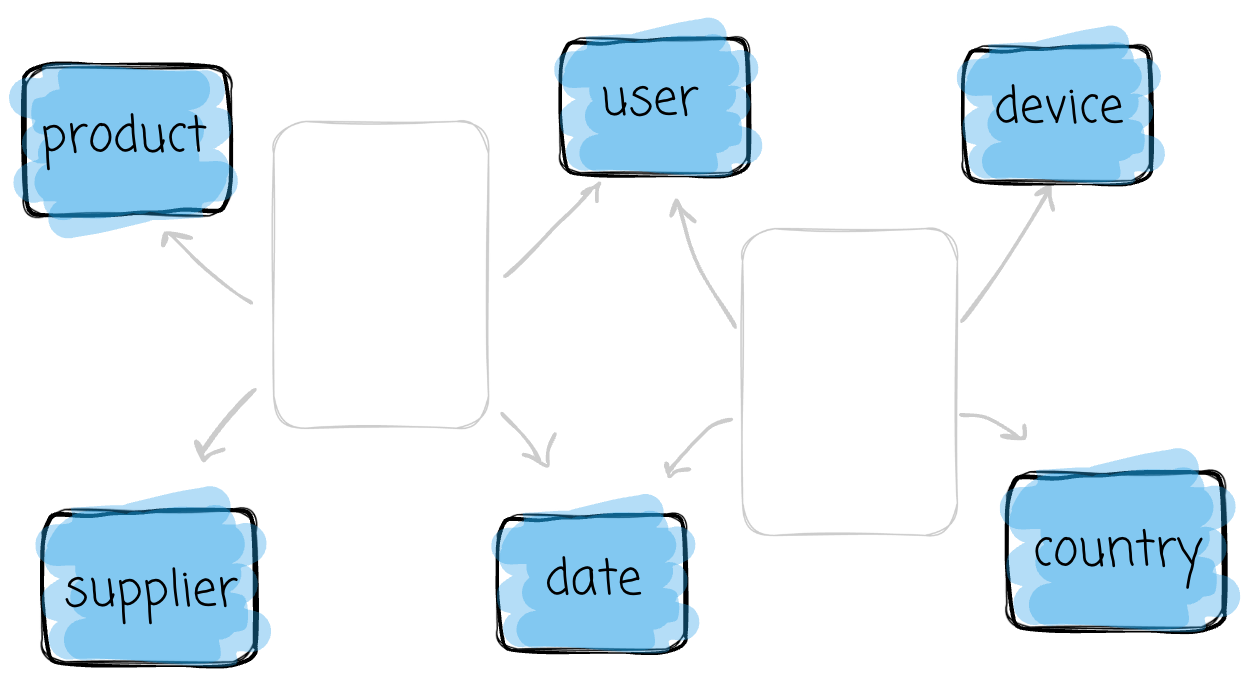
They play a crucial role in the data warehousing system because they provide a context for measurements. A skyrocketing revenue number alone does not give insight into the business. Each dimension table has a single primary key. This key is “distributed“ to the fact tables as a foreign key.
The four-step process
There are four steps in the dimensional design process:
The process begins with selecting the business process, in which you identify the key activity or operation to analyze, such as sales or customer interactions.
Next comes declaring the grain, which defines the level of detail for the analysis: “Are you tracking sales by individual transactions, daily summaries, or monthly aggregates?” This ensures consistency and scalability.
Once we define the grain, we identify dimensions that capture the process's descriptive attributes, such as product details, time, or customer demographics.
Finally, we focus on building facts and the quantitative metrics tied to the process, such as sales revenue and profit.
Each step builds on the last, ensuring the design supports the bottom-up business's analytical needs while remaining easy to query and understand.
dbt
dbt is a CLI tool that lets us efficiently transform data with SQL.

It’s not an engine like Spark; it’s not a database like Postgres or Snowflake; it’s a tool that helps you manage your SQL data transformation.
At the heart of dbt is the concept of the model. A model is an SQL query saved in a .sql file. Each model defines a transformation that transforms data into a desired output inside your data warehouse. When dbt runs, it executes these queries and materializes the transformed data as a table or view. Models give us a tangible form of the SQL transformation logic.

We write dbt models and run some commands in the terminal. It will compile all the model’s code into SQL statements and execute them on the data warehouse. The model’s code combines SQL and Jinja.

In this project, we will use dbt to manage our SQL transformation, from raw data to nicely organized, dimensionally modeled data.
Don’t mistake this with data modeling.
In this project, I facilitate the data transformation through three stages: raw data is loaded as is to the landing, standardized in staging, and transformed to facts and dimensions in the curated environment. This is similar to the Medallion Architecture, where data is organized into bronze, silver, and gold layers.
Please keep in mind that the bronze, silver, and gold layers, or whatever name you prefer, are not data modeling; they’re just a way for us to facilitate data cleaning and transformation.
Set up the dbt
High-level setup
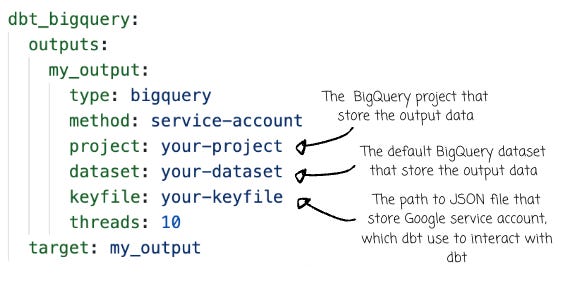
Depending on your data warehouse, you need to input the required information into the `profiles.yaml` so dbt can connect with the warehouse. Please visit the dbt official documentation for your preferred warehouse. In my case, I chose to go with BigQuery. Here is the thing I need to input into the `profiles.yaml`
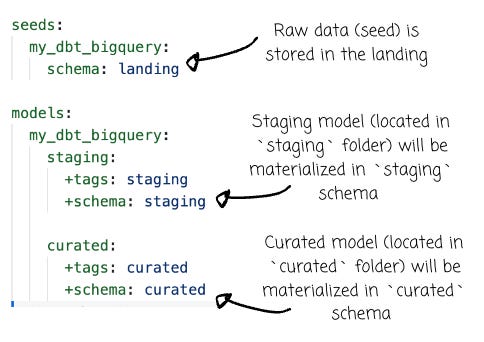
In the `dbt_project.yml` files, besides basic configuration, I specify the location for the raw data (which is loaded by dbt seed) and the processed data in staging and curated:
Loading example data
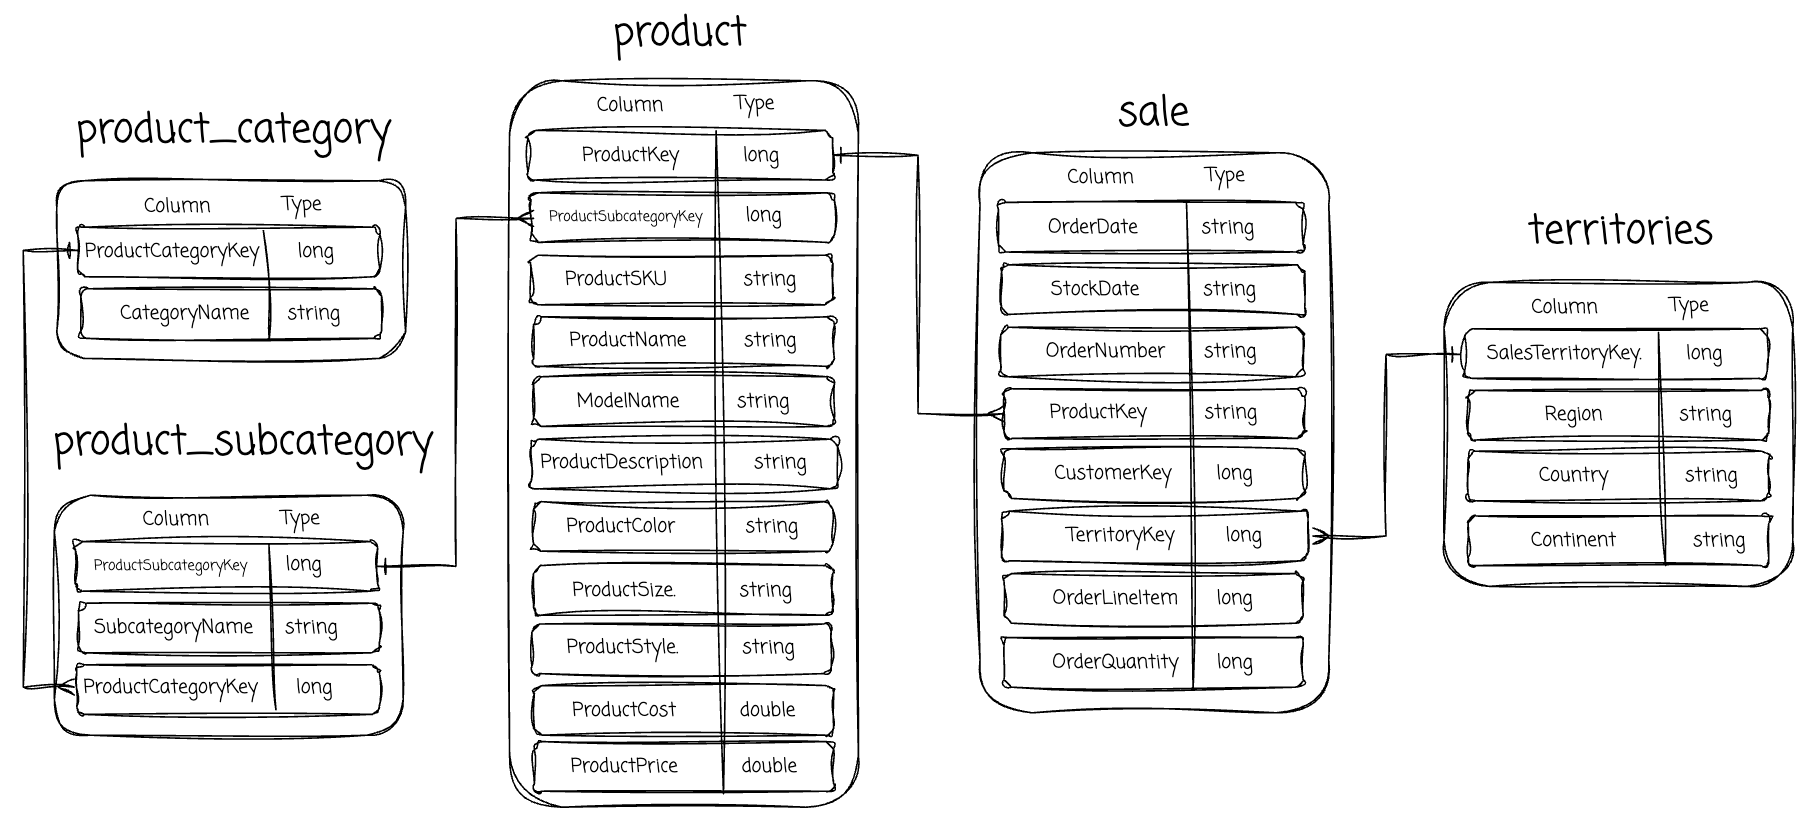
For the sample data, we used tables from the AdventureWorks sample dataset: product, product_category, product_subcategory, sale, and territories. For this project, I cooked (with the help of AI) the data to stimulate the change of the data over time. The name convention will be table_name_<date>, for example, product_20250801 will be the snapshot of the product data at 2025-08-01.
AdventureWorks database supports standard online transaction processing scenarios for a fictitious bicycle manufacturer - Adventure Works Cycles.
This is your last chance to grab the 50% discount on the yearly package; the offer will end today.
Keep reading with a 7-day free trial
Subscribe to VuTrinh. to keep reading this post and get 7 days of free access to the full post archives.